Reporting Crashes in Scribe
If Scribe crashes it will usually generate a crash dump. These are needed to see where the crash occured so it's important to send them to me along with any crash report.The things that I need in a crash report are:
- What was happening at the time of the crash.
- The version of Scribe you are using.
- The operating system version (and any service packs installed).
- The crash dump file itself. See below:
WindowsIf you get an "Application Crash"...This application has crashed. A mini dump has been written to: ... 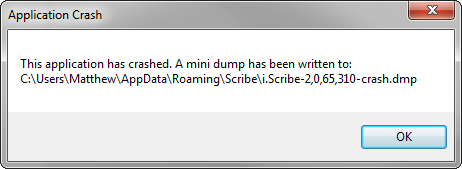 Take careful note of the path to the crash dump. On modern windows it will
be:
Take careful note of the path to the crash dump. On modern windows it will
be:C:\Users\username\AppData\Roaming\Scribe\Scribe-#,##,##,##-crash.dmpBut on Windows XP it should be: C:\Documents And Settings\username\Application Data\Scribe\Scribe-#,##,##,##-crash.dmpIf you have trouble getting to the AppData folder, just type it into the path bar like this. Then find the latest .dmp file: 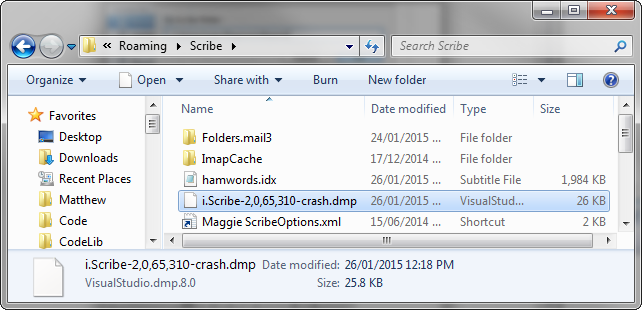 And send it to me. Once you have sent me the file, you can delete it.
|
MacIf you get "Scribe quit unexpectedly"...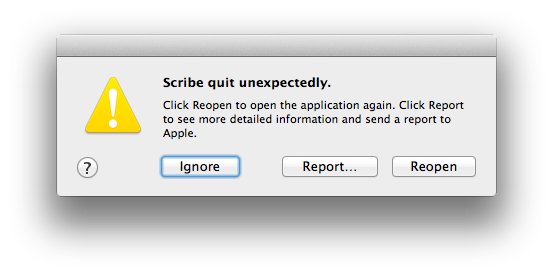 Open Finder and from the Go menu select "Go To Folder..."
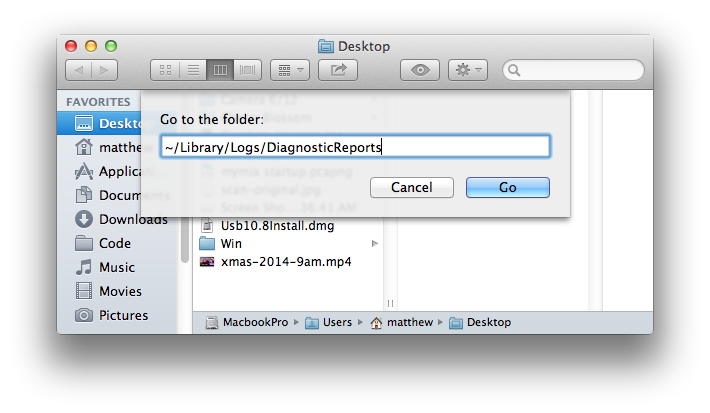 And enter the name: ~/Library/Logs/DiagnosticReports
In that folder there should be some crash dump files starting with "Scribe": 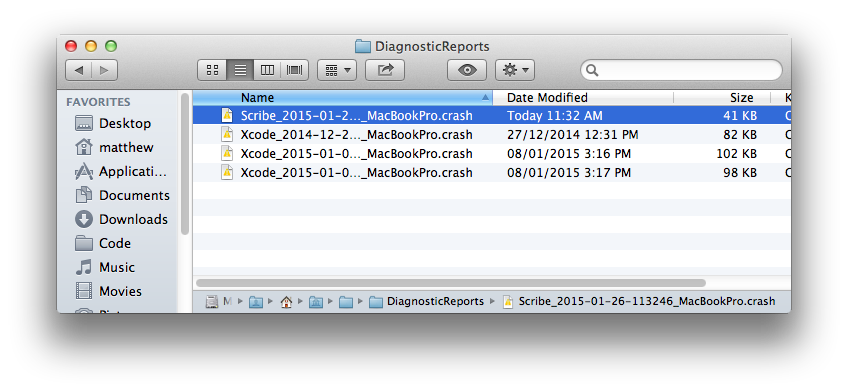 Send me that file(s) and then delete any old reports.
Please include the version of Scribe you are running and what version of OS X
you are using.
Send me that file(s) and then delete any old reports.
Please include the version of Scribe you are running and what version of OS X
you are using.Leave any files not starting with "Scribe" alone. |
LinuxTo debug a crash on Linux first you have to turn on core dumps. So open a terminal and enter these commands:Change directory to where Scribe is installed: Set the ulimit to allow core files: Now run the application from the terminal: And do whatever until the software crashes. Then a core file should be creating in the current folder. Check that it's there: At this point just zip up the core file and send it to me or host it somewhere (e.g. Dropbox or Google Drive) and send me a link. Alternatively you could do a stack trace for me and send me that instead: Then to get the stack trace type in 'bt': (gdb) bt (gdb)Then send me the output from that command. |